- Trendency's Political Trendwatch
- Posts
- 2024 Voter Overview: Part 3A
2024 Voter Overview: Part 3A
How where you live affects your political views (sort of): A look at voters in rural areas
Continuing with our look back at the 2024 election, in this installment we are looking at the differences between urban, suburban, and rural voters. You can always access the past reports here.
A large portion of former Vice President Kamala Harris’ presidential campaign last year focused on the “opportunity economy”, small business owners and farmers, tax cuts for the “sandwich” generation, hefty border enforcement, and building a powerful military force. Her campaign targeted, among other groups, historically Republican, moderate suburbanites, with a special focus on women who may have supported Nikki Haley’s presidential campaign. At the same time, Donald Trump’s campaign focused a lot of attention on young men in untraditional ways. His appearances on famous podcasts such as the Joe Rogan Experience and with streamers such as Aiden Ross helped him reach an audience that usually is completely disengaged from politics. He also gained significant endorsements from other figureheads in adjacent industries, such as Jake Paul, a famous YouTuber turned boxer, and FaZe Banks, a professional gamer.
When it came to turnout, versus persuasion efforts, both campaigns took a more traditional approach with the Harris campaign viewing urban areas as more turnout friendly while the Trump campaign was looking to turn out as many voters in rural areas as possible.
Given all these efforts, we thought it would be interesting to look at these three broad cohorts to see if there is anything in the data to point to success for the campaigns, or results that were surprising. From a topline view, the results were as expected: Rural voters favored Trump’s candidacy. Urban voters strongly favored Harris’ candidacy. Suburban voters also favored Harris’ candidacy, although to a lesser extent (Figure 1).
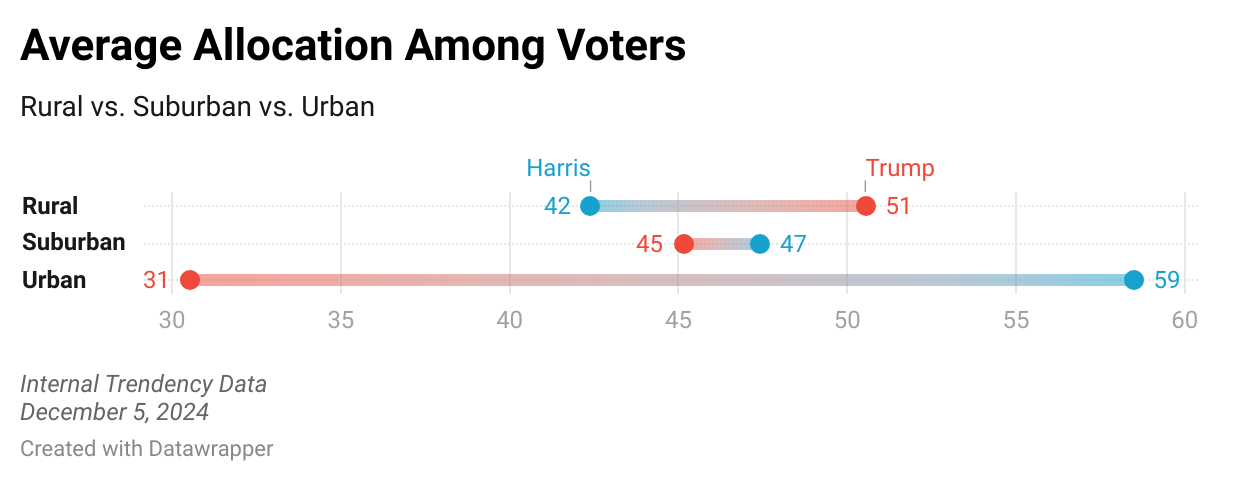
Figure1: Overall allocation of support
As a reminder, Trendency does not ask questions in a binary fashion (e.g. are you voting for Harris or Trump?). Instead, we asked panelists to allocate points to each candidate indicating the chance they would vote for one or the other. This approach allows panelists to give more nuance in their responses, allowing us to understand how opinions are shifting, not just on either candidate, but on each candidate themself. Unlike other polls, this method gives us an insight into voter confidence which can help us estimate future behavior.
While the topline results are not shocking, what you see on the surface can oftentimes not be the whole story. For this installment we will be looking at Rural voters, with Suburban and Urban voter analysis to be released in short order.
Rural Voters
Rural voters make up the smallest portion of the population as a whole. In our panel, 69% of our rural voters are female and 31% are male. Nearly 9 in 10 (89%) are White and 11% are BIPOC. When it comes to party affiliation, 28% identify as Democrats, 36% as Republicans, and 36% as Independent.
Across the board, these voters leaned toward Trump when asked to allocate the chance they would support either candidate’s candidacy before Election Day (Figure 2). The strongest levels of support - by far - came from men, while Harris’ highest levels of support in rural areas came from women and rural voters over the age of 65. Harris trailed among all of these demographic cohorts.
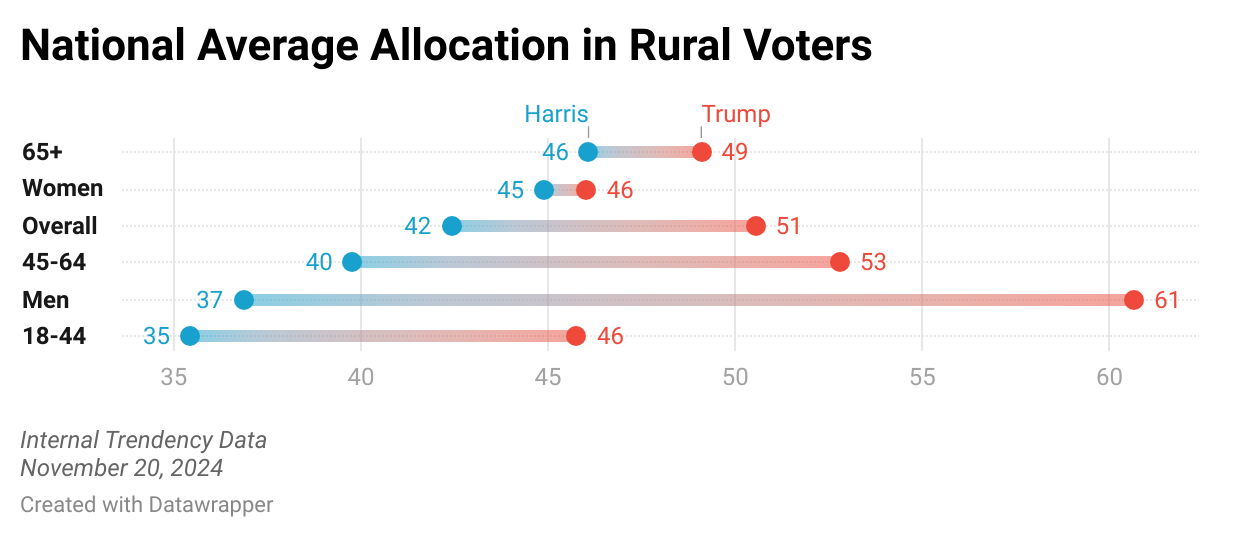
Figure 2: Overall allocation of support
When dealing with averages, the overall results often mask what truly is occurring in the data. An average of 50 doesn’t mean everyone is equally allocating between each option and is completely undecided; rather, most felt strongly in favor of one candidate and were strongly opposed to supporting the other. As seen in Figure 3, when asked to allocate 100 points between answer options, 41% of rural voters allocated 80 or more points on their likelihood of supporting Harris in her candidacy, and 56% allocated less than a 20% chance of supporting her candidacy. Conversely, 49% of rural voters allocated 80 points or more in strong support of Trump’s candidacy and 48% allocated less than a 20% chance of supporting his candidacy. Almost zero voters were undecided about which candidate they would support.
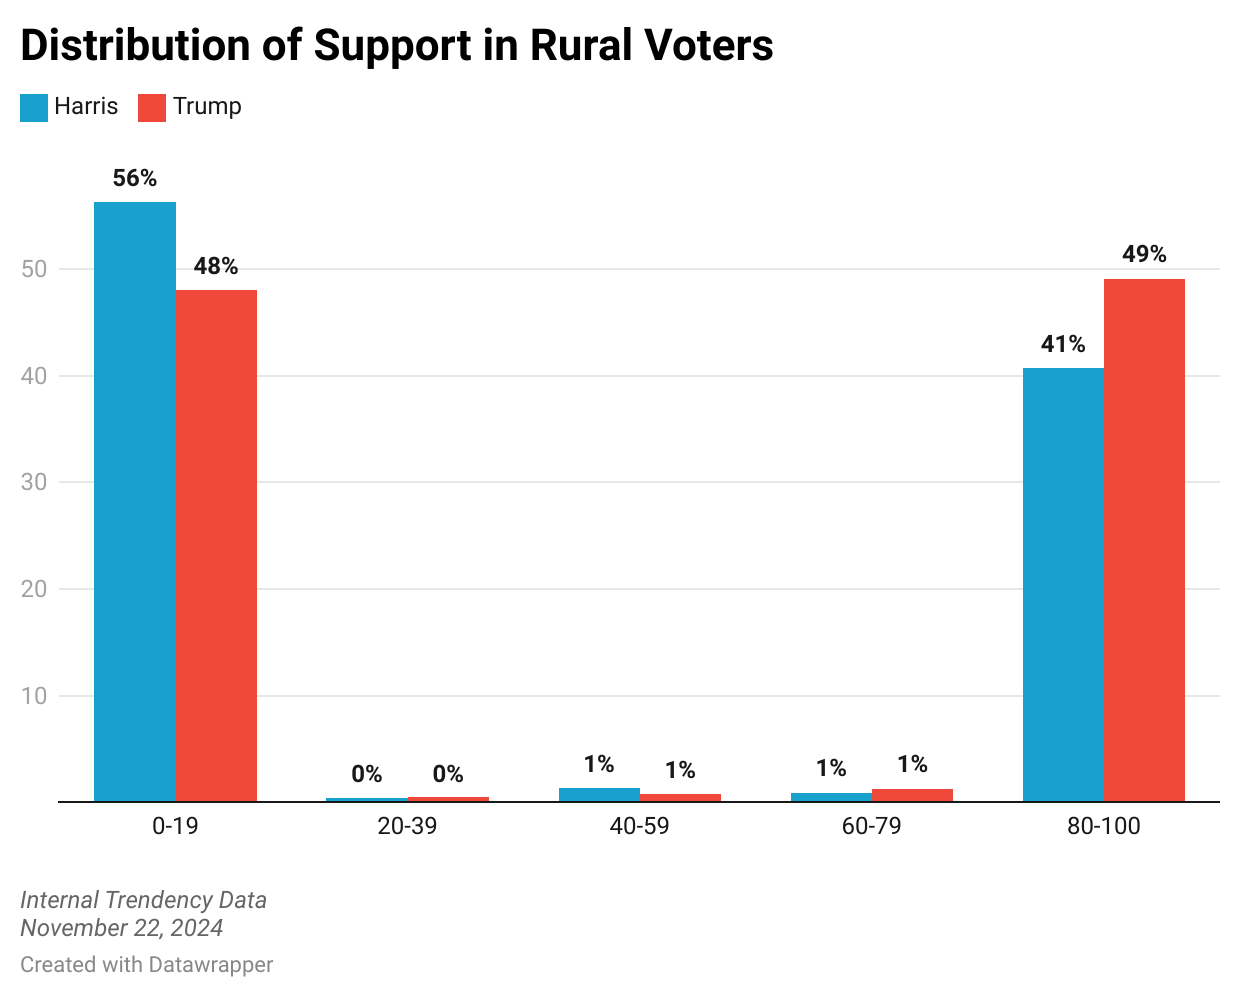
Figure 3: Allocation of support
Both candidates had high percentages of voters who allocated a less than 20% chance of supporting their candidacy, and for both candidates the opposition was stronger than the support levels. Said in another way, for many rural voters, this election was motivated slightly more by opposition to the other candidate versus supporting their preferred candidate.
To add some context to these numbers, when we compare where rural voters were four years ago, we can see that from the middle of July through the election in 2024 the race was much closer on average, with Harris over-performing Biden, and Trump under-performing his support from the last election (Figure 4). Despite Harris outperforming Biden’s 2020 numbers and Trump underperforming his own numbers from four years ago, Trump maintained a consistent lead among voters in rural areas.
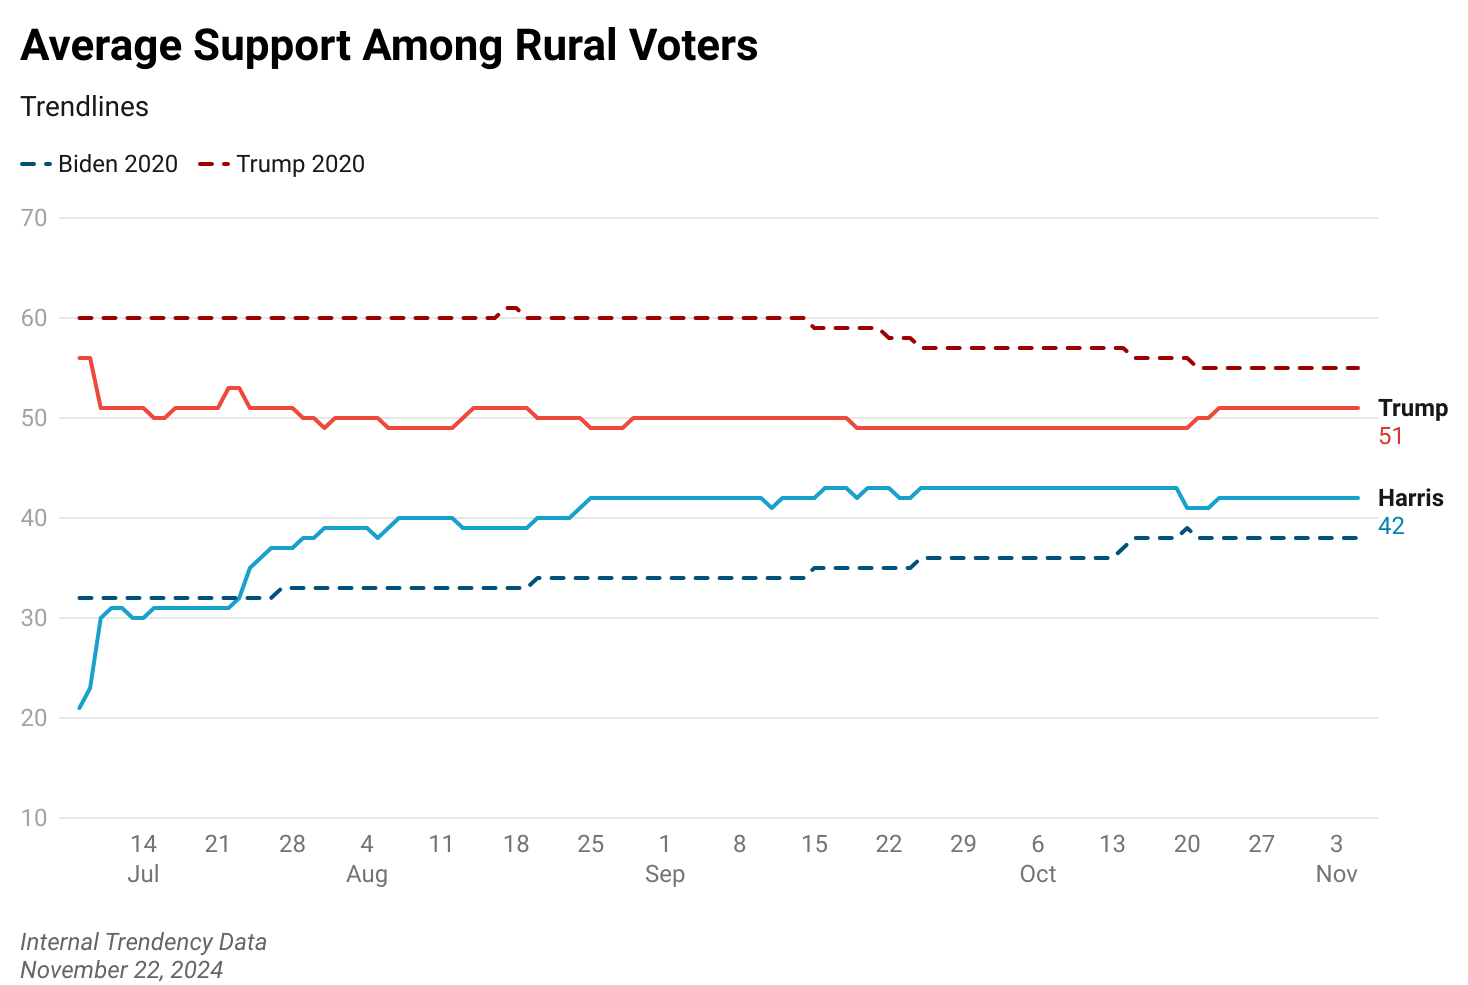
Figure 4: 2024 vs 2020 support levels
Because the average will include both high allocations of 100 and low allocations of zero (0), we look solely at the strong supporters in a measure called the Commitment Index to get a better view of how committed to each candidate rural voters were (Figure 5). Commitment for Trump was greater than commitment for Harris across all demographic groups except for women, whose indexes were tied. The group with the highest commitment to Trump was men, while the group with the highest commitment to Harris was voters above the age of 65.
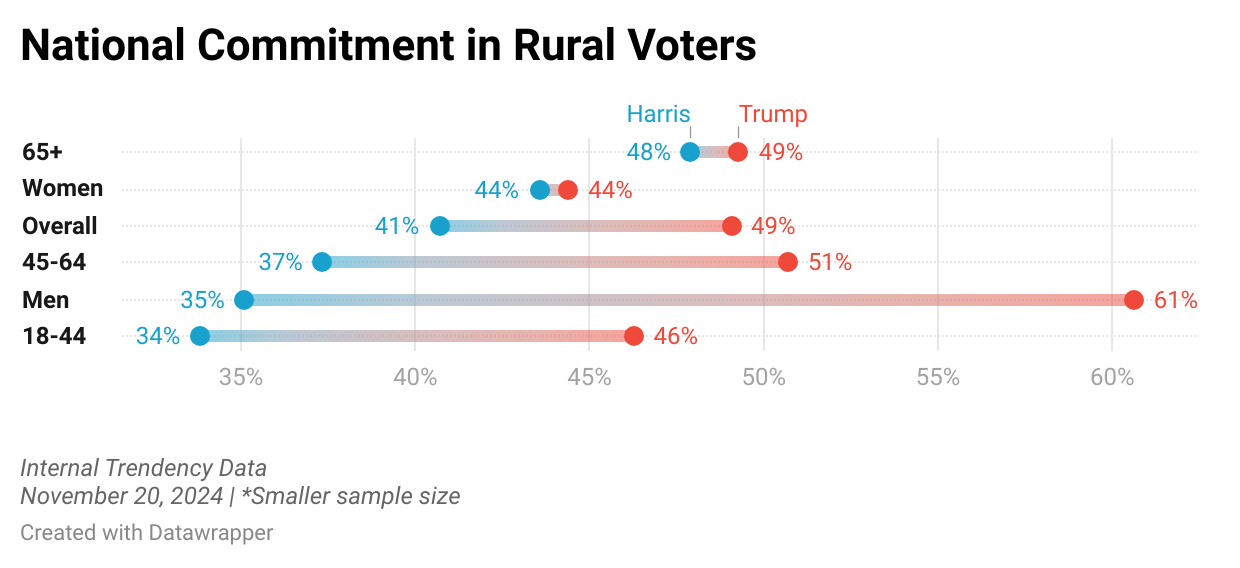
Figure 5: Commitment Index
When comparing the commitment indexes for Biden in 2020 to the commitment indexes for Harris in 2024, overall support for the Democratic nominee in 2024 increased by 3% (Figure 6). The highest increases in commitment for Harris compared to Biden were from rural voters above the age of 65 and women. In every other demographic, strong support decreased.
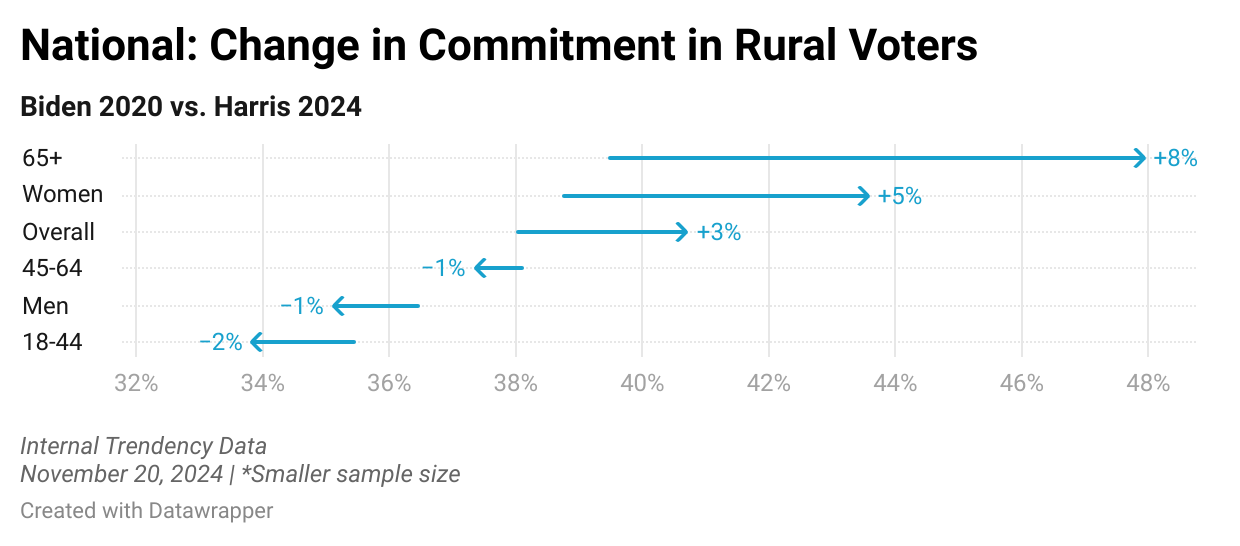
Figure 6: Democratic Commitment Index Change from 2020 to 2024
While Harris strong support was lower among a few cohorts compared to Biden in 2020, strong support for Harris as the 2024 Democratic presidential nominee increased overall by three percentage points when compared to support for Biden in 2024 among rural voters (Figure 7) in July when he was still the presumed candidate. The largest increase in commitment when the party moved from Biden to Harris was among voters under 45, with a bigger than 20 point increase.
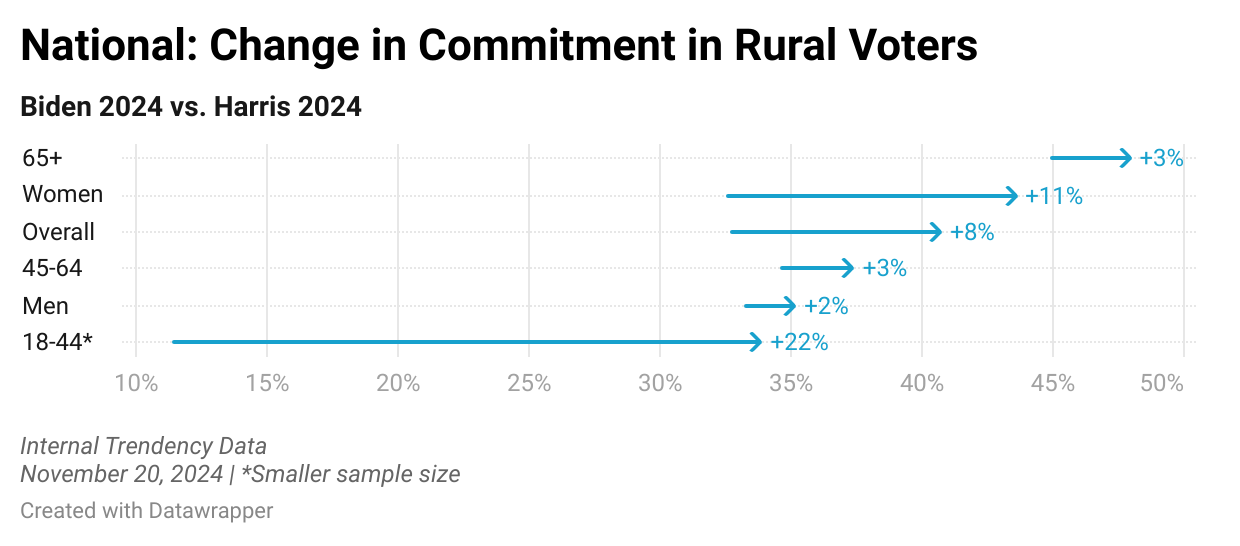
Figure 7: Harris vs Biden strong support
Strong support for Trump among rural voters decreased by 2% when compared to his numbers in 2020 (Figure 8). The largest decrease came from women. In two demographic groups, strong support for Trump increased: men and voters under the age of 45.
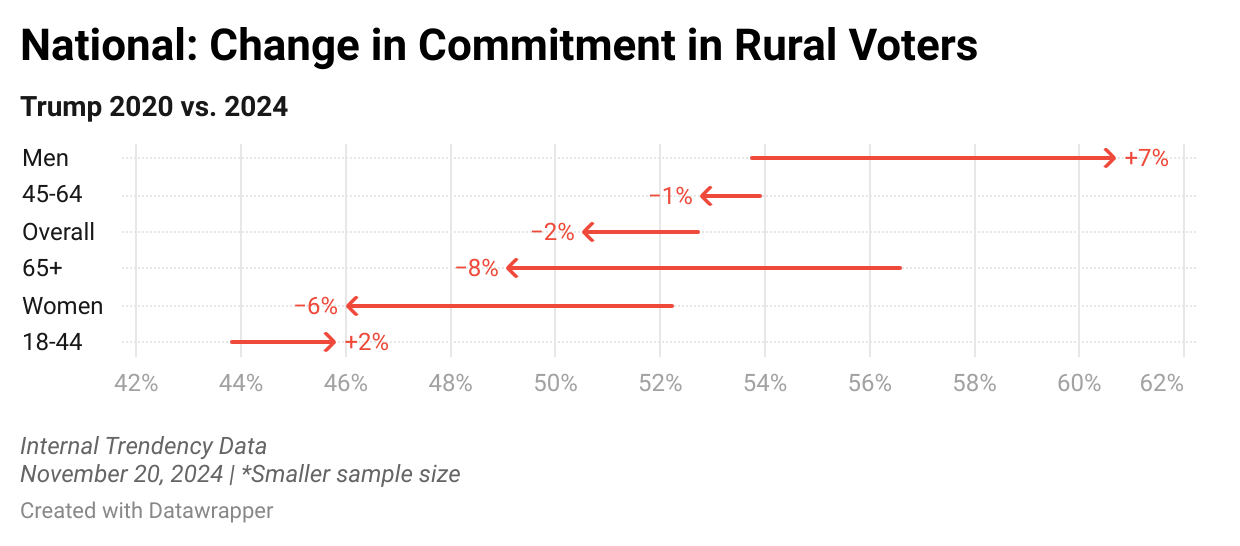
Figure 8: Trump Change in strong allocation of support
Compared to support for Trump before Biden dropped out of the race in 2024, overall support among rural voters did not change; however, there were several small demographic shifts among voters in rural areas (Figure 9). The only group to increase commitment to Trump was voters over the age of 65.
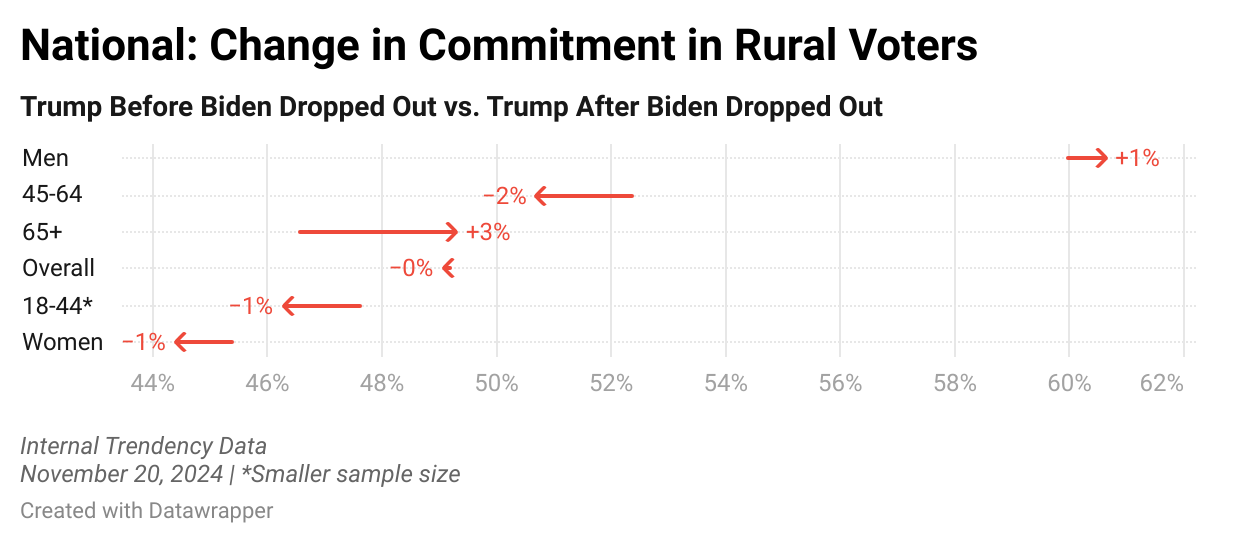
Figure 9: Trump Change in strong allocation of support after Biden dropped out
These results give us several takeaways about the motivations of rural voters in the 2024 presidential election and how they’ve shifted since the 2020 election.
First, overall voter commitment was higher for Trump than it was for Harris. For Trump, this means that a larger percentage of his audience was voting in favor of him. For Harris, it means that a larger percentage of her audience was voting against Trump. Rural Harris supporters did not align themselves with her campaign and instead tended to come together because they did not want to support Trump.
Second, neither candidate had a commitment level above 50%. As seen in the overall distribution of support for each candidate, almost zero rural voters were uncommitted to either candidate, meaning that the majority of voters were voting against a specific candidate.
Thirdly, among rural democratic candidate supporters, the demographic who was most committed to supporting their candidate were voters above the age of 65. This cohort also experienced the largest decrease when compared to commitment in 2020; however, it did increase slightly when Biden dropped out of the race in July.
Fourth, voters under the age of 45 were among the least committed to either candidate. Despite the jump in commitment for the Democratic candidate when Biden dropped out, they were still the least committed demographic for the Democratic candidate. Younger rural voters were not particularly for either candidate in this election and were the most motivated to vote against a candidate. Fifth, voters saw Harris as an overall improvement compared to Biden in 2024.
Look for the next installment on suburban voters soon.